Understanding Data Lakes: From Raw Files to Business Insights

In today’s data-driven world, organizations are swamped with information from a myriad of sources: user interactions, application logs, social media, IoT devices, and much more. This data arrives in various formats – structured, semi-structured, and unstructured. The challenge isn’t just collecting this data, but storing, processing, and extracting valuable insights from it. Enter the Data Lake.

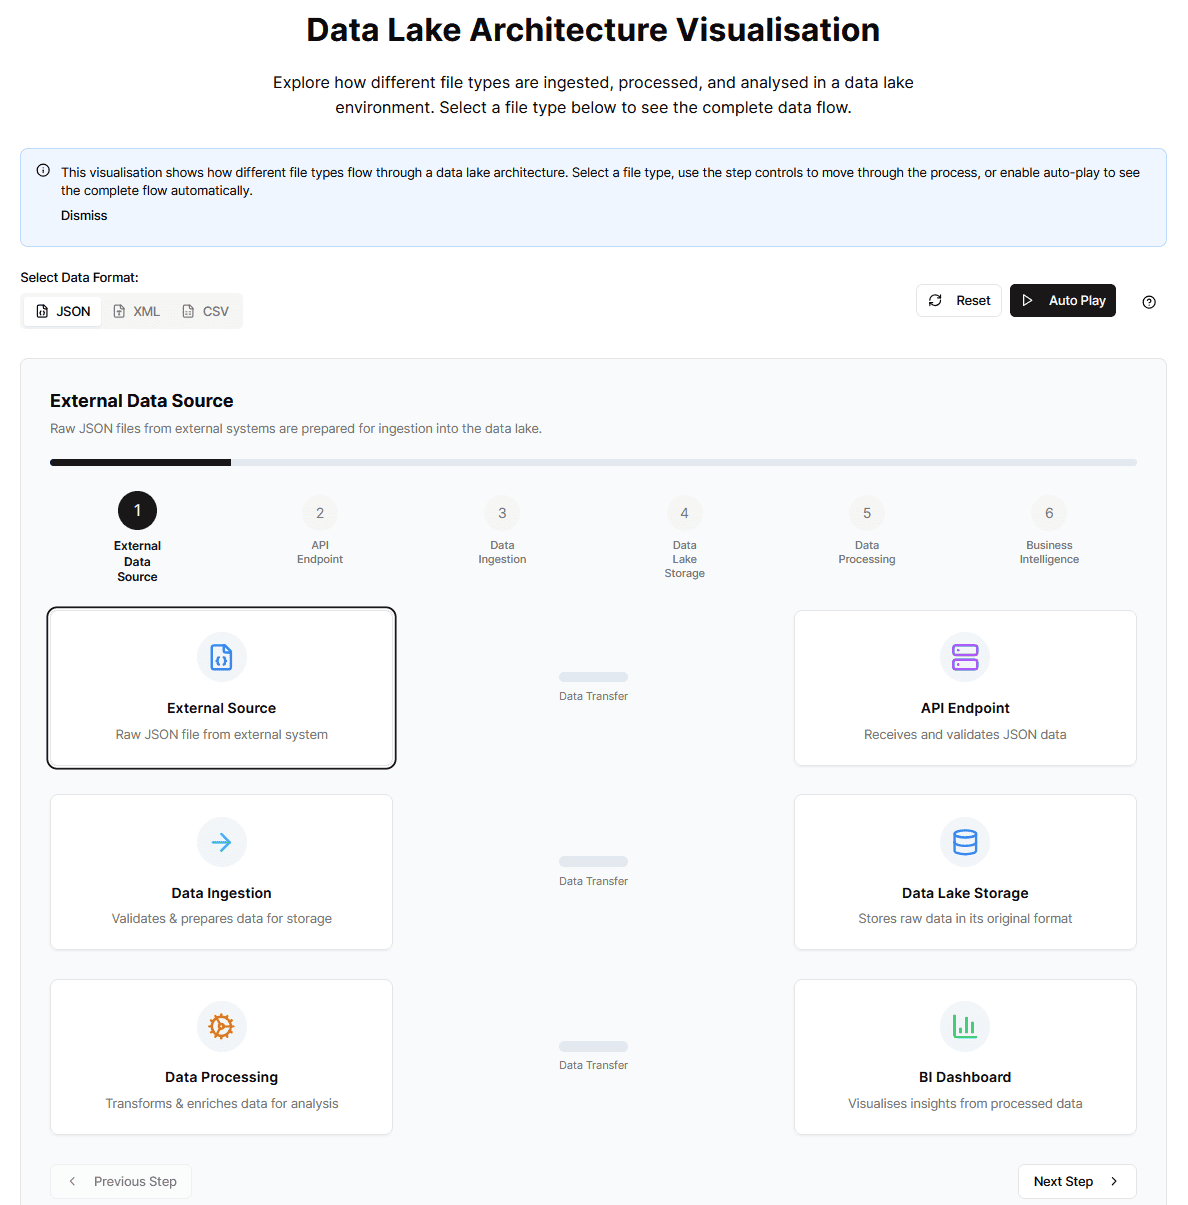
But what exactly is a data lake, and how does it work? The interactive “Data Lake Architecture Visualisation” demo you’re exploring lets you click through the end-to-end journey of three common file types, JSON, XML, and CSV, as they move from an external source, through an API, into a data lake, and finally into a business-intelligence (BI) dashboard.

This article is your companion guide to that demo. It will:

  • Explain what a data lake is (and isn’t) for absolute beginners.
  • Connect each screen and interaction you see in the demo with real-world data-engineering concepts.
  • Dive deeper for intermediate and advanced readers into topics like medallion architecture, ACID table formats, cost control, and governance.


You can check the demo out here: https://interactivedatalakedemo.foreranger.com/

Understanding Data Lakes: From Raw Files to Business Insights – An Interactive Journey with Our Demo

Data Lakes in Plain English

Beginners’ takeaway: A data lake is like a vast natural reservoir. It collects water (data) from many rivers and streams (sources) in its original, unfiltered form. It stores any data, in any format, until you decide what you want to do with it.

Traditional databases and data warehouses require you to design strict tables and define the structure of your data before loading it (a concept called schema-on-write). A data lake flips that script:

Feature

Data Lake

Data Warehouse

Schema

On read (decide structure later)

On write (schema enforced upfront)

Formats

Structured, semi-structured, unstructured

Primarily structured

Cost per GB

Low (typically object storage)

Higher (database storage)

Typical uses

Long-term archive, ML model training, log analytics, data exploration

Business reporting, financial statements

A data lake’s flexibility in storing data in its raw, native format is its superpower. The structure (or schema) is applied only when you need to read and analyse the data (schema-on-read). This is crucial for data scientists who want to explore data in its most detailed form and provides immense flexibility for future, unforeseen analysis.

However, this flexibility can also be its most significant risk: without a plan and proper processes, a tidy lake can devolve into a “data swamp” where data is complex to find or trust. The demo you’re exploring shows how tooling and distinct processing stages help prevent that.

Demo Tie-in: In our demo, notice the “Select Data Format” option at the top-left. You can choose between JSON (often from web apps, APIs), XML (common in enterprise systems), and CSV (tabular data from spreadsheets, databases). This directly illustrates the data lake’s ability to ingest various data types right from the initial “External Data Source” stage.


Quick Glossary

Keep these terms in mind as you click through the demo:

  • Schema-on-read: Structure is interpreted when the data is queried, not when it is first stored.
  • Ingestion: Collecting data (batch or streaming) and landing it in the lake.
  • Medallion architecture: A typical data organisation pattern: Bronze (raw data), Silver (cleaned, conformed data), and Gold (curated, business-ready aggregates) layers that gradually improve data quality.
  • Delta Lake / Apache Iceberg / Apache Hudi: Table formats that add ACID (Atomicity, Consistency, Isolation, Durability) guarantees, versioning, and other data management features to data stored in object storage.
  • Lineage: A record of how data moved and changed over time, crucial for governance and trust.

Walking Through the Demo, Step by Step

Our interactive demo breaks down the data lake process into six key stages. As you switch between JSON, XML, and CSV tabs at the top-left:

  • Icons throughout the demo may recolour to match the selected file type.
  • Sample records in the “Raw Data” pane of the DataSample component (typically on the right) will update.
  • Descriptive text for each stage will dynamically insert the chosen format (e.g., “Raw XML files from external systems…”).


Let’s explore each stage:

Stage 1: External Data Source

  • What you see: A coloured file icon representing the origin of your data.
  • What it is & Behind the scenes: This is where your data originates – from applications, databases, IoT sensors, SaaS exports, partner SFTP drops, etc. This stage involves networking, authentication, and file-naming conventions in real projects.
  • Demo Tie-in: The journey begins here. The “Raw Data” tab within the DataSample component shows you a snippet of this data in its original, untouched format. The step description highlights: “Raw [FILE_TYPE] files from external systems are prepared for ingestion…”


Stage 2: API Endpoint

  • What you see: A Server icon.
  • What it is & Concepts tied in: Often, data is sent to an API (Application Programming Interface) endpoint, which acts as a secure and controlled entry point. This endpoint can perform initial validation (e.g., is the file really JSON?), handle security (OAuth2, signed URLs), manage rate limiting, and even perform initial schema inference.
  • Demo Tie-in: This stage shows the data hitting our system. The description mentions: “API endpoints receive the [FILE_TYPE] data and validate its structure…” The DataFlowAnimation component, with its moving dots, visually signifies the data transfer from the source to this endpoint.


Stage 3: Data Ingestion

  • What you see: An Arrow Right icon and progress dots flowing.
  • What it is & Real-world parallels: This is the process of actively bringing data into the data lake. It can involve various tools and techniques (like Fivetran, Airbyte, Kafka Connect, or custom Lambda jobs) to collect, transport, and prepare data for storage. This might include basic validation or tagging metadata (like source and arrival time) and moving the object to a “Bronze” layer in a medallion architecture.
  • Demo Tie-in: The icon symbolises this movement into the lake. The description tells us: “The ingestion layer processes incoming [FILE_TYPE] data, validates it, and prepares it for storage…” The DataFlowAnimation between this stage and storage continues the visual journey.


Stage 4: Data Lake Storage

  • What you see: A Database icon.
  • What it is & Under the hood: This is the core of the data lake, where the raw data is stored. It’s typically built on scalable and cost-effective object storage solutions like AWS S3, Azure ADLS, or Google Cloud Storage. File formats remain unchanged; the lake retains the raw bytes for replayability and future analysis.
  • Demo Tie-in: Crucially, if you check the DataSample component at this stage, the “Raw Data” tab still shows the data in its original format. This is the essence of a data lake: preserving the original fidelity. The step description confirms: “Raw [FILE_TYPE] data is stored in its original format…” This is where the “schema-on-read” power truly lies; the data is just sitting there, waiting for interpretation.


Stage 5: Data Processing

  • What you see: A Cog icon.
  • What it is & Tech you’d use: Once data is in the lake, it often needs to be processed to make it usable for analysis. This can involve cleaning (removing errors), transforming (converting formats, structuring), enriching (adding more information like total_value or category), and aggregating data. This stage often creates the “Silver” layer in a medallion architecture. Technologies like Apache Spark, dbt, Databricks Autoloader, or Apache Flink are commonly used here. Transformations include schema alignment and partitioning for efficiency.
  • Demo Tie-in: This icon signifies the transformation phase. Now, the DataSample component becomes very interesting:
  • Switch to the “Processed” tab. You’ll notice that regardless of the original input (XML or CSV), the data is often shown in a standardized JSON format. This is a common practice – to convert various data types into a consistent format for easier downstream processing.
  • You’ll also see new fields like “total_value” (e.g., calculated from quantity * price) and “category” might have been added. This demonstrates data enrichment.
  • The description explains: “Data processing transforms the raw [FILE_TYPE] data into a standardised format, enriches it…”
  • The “Data Transformation Explanation” section within the DataSample card (if present in your demo) explicitly details what’s happening at this stage.


Stage 6: Business Intelligence & Analytics

  • What you see: A BarChart3 icon.
  • What it is & Reality: This is where the value is unlocked. Processed data (often from a “Gold” layer – clean, denormalized tables optimized for dashboards) is consumed by BI tools (like Power BI, Tableau, Looker), analytics applications, machine learning models, and dashboards to generate reports, visualizations, and actionable insights.
  • Demo Tie-in:
  • In the DataSample component, the “Analysis” tab shows a simplified example of analytical output – perhaps aggregated sales figures (like “total_sales”), item counts, or category breakdowns (e.g., “avg_price” per category).
  • The description states: “Business intelligence tools analyse the processed data to extract insights…” This is the culmination of our data’s journey.


Tip: Hit the “Autoplay” button in the demo to see all stages animate automatically, or click individual step numbers/indicators to jump non-linearly.

Why Bother with a Data Lake? The Benefits.

Our demo gives you a visual feel, but why do organisations invest in data lakes?

  1. Flexibility & Agility: As seen with the JSON, XML, and CSV examples in the demo, data lakes handle diverse data types effortlessly. This allows businesses to incorporate new data sources without a lengthy setup, quickly.
  2. Scalability: They are designed to store massive volumes of data, growing as your needs grow.
  3. Cost-Effectiveness: Often leverage commodity object storage and open-source technologies, making them cheaper than traditional data warehouses for storing large raw datasets.
  4. Advanced Analytics & Machine Learning: Raw, granular data is a goldmine for data scientists. Data lakes provide the perfect environment for training complex ML models and performing deep exploratory analysis.
  5. Data Exploration & Discovery: Because all data can be centralised, users can explore and discover relationships and patterns that might have been hidden in siloed systems.

Deeper Dive for Intermediate & Advanced Readers

Our demo provides a foundational understanding. In real-world, sophisticated data lake environments, you’ll encounter more advanced concepts:


Medallion Architecture in Practice

This is a popular data organisation pattern within a data lake, structuring data into layers:

Layer

Purpose

Typical File Ownership

Bronze

Immutable raw data; audit trail

Data engineering

Silver

Cleaned, conforming, join-ready data

Data engineering

Gold

Business aggregates, denormalised marts

Analytics / BI teams

Automated jobs promote data through these layers, often with capabilities like Delta Lake’s time-travel checkpoints so you can roll back to previous versions if needed. Our demo simplifies this but shows the conceptual transition from raw (Bronze-like) to processed (Silver-like) to analysed (Gold-like).


Table Formats and ACID Guarantees

Formats like Delta Lake, Apache Iceberg, and Apache Hudi bring features traditionally found in databases to data lakes built on object storage:

  • Delta Lake (open-source by Databricks) writes a transaction log (_delta_log/) beside Parquet files.
  • Apache Iceberg and Apache Hudi offer similar guarantees and work well with query engines like Presto/Trino, Spark, and Flink. These formats provide ACID transactions, schema enforcement, versioning (time travel), solve the “small files” problem, support efficient MERGE INTO operations for upserts, and enable robust data lineage tooling (e.g., via OpenLineage).


Streaming vs. Batch Ingestion

The demo primarily visualises batch data movement (dots flowing then stopping) for clarity. In production, you may switch or combine this with a streaming paradigm for real-time data:

↑ MQTT / Webhook → Kafka Topic → Incremental Lake Table (e.g., using Spark Streaming or Flink) → Real-time Dashboard


Governance & Security

As data lakes grow, managing data quality, security, access control, and lineage becomes critical:

  • IAM (Identity and Access Management): Fine-grained role-based access to storage buckets/containers and services.
  • Row- and column-level security: Implemented via tools like Apache Ranger, AWS Lake Formation, or features within query engines or data warehouse platforms built on lakes (e.g., Snowflake’s masking policies).
  • Lineage & Catalogue: Tools like Apache Atlas, DataHub, or OpenLineage help analysts and data consumers understand data origins, transformations, and build trust in what they query.


Common Pitfalls & How to Avoid Them

Pitfall

Prevention

Data swamp—no one knows what lives in the bucket

Enforce naming standards, use a data catalog, tag ownership, document data.

Expensive queries—petabytes scanned for a quick graph

Partition data (e.g., by date/source); use Z-ordering or similar indexing techniques; optimize table formats.

Duplicate data copies across teams

Promote data through medallion layers instead of duplicating full datasets per team; use views.

Explore and Learn!

We encourage you to spend time with the Data Lake Architecture Visualisation:

  • Switch between JSON, XML, and CSV file types to see how the initial raw data and descriptions change.
  • Use the “Next Step” / “Previous Step” buttons or click directly on the step indicators/icons to navigate the flow.
  • Enable “Autoplay” for a guided tour.
  • Pay close attention to the DataSample component (Raw, Processed, Analysis tabs) at each stage to see how the data’s representation evolves.
  • Read the contextual descriptions for each step.